Prop Firms page
See which prop firms deserve your next fee and dive deeper into your prop firm performance
Written By Delyan
Last updated 6 months ago
This article explains how to use the Prop Firm Trading → Prop Firms page to compare firms, track challenge outcomes, and review payout performance.
The Prop Firms page helps you identify which firms pay reliably, which challenges convert best, and where your current funding stands—without spreadsheets.
How It Works
Prop Firms Overview
The Prop Firms page aggregates all firm-level data from your payouts and expenses into dashboards, funnels, and detailed firm views. All metrics update automatically based on your selected filters.
Using the Prop Firms Page
Step 1 – Open Prop Firms
From the sidebar, navigate to:
Prop Firm Trading → Prop Firms

You’ll land on the firms dashboard showing:
Total earnings across firms
Active firms vs total firms
Current funding (USD)
Challenges bought
Total payouts
Challenges-to-payouts ratio
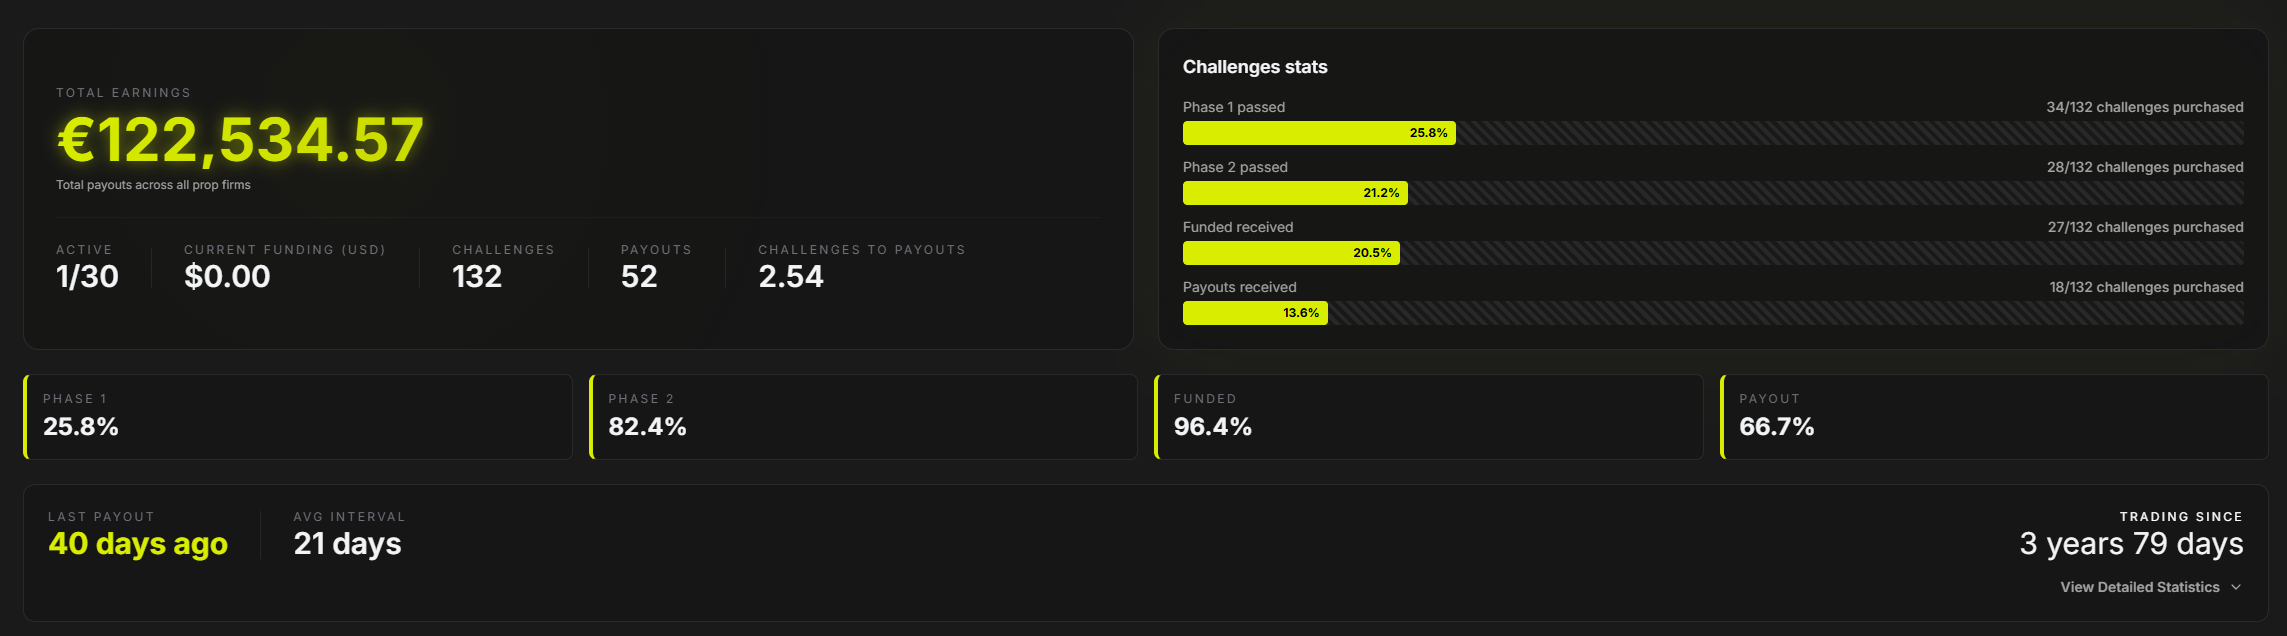
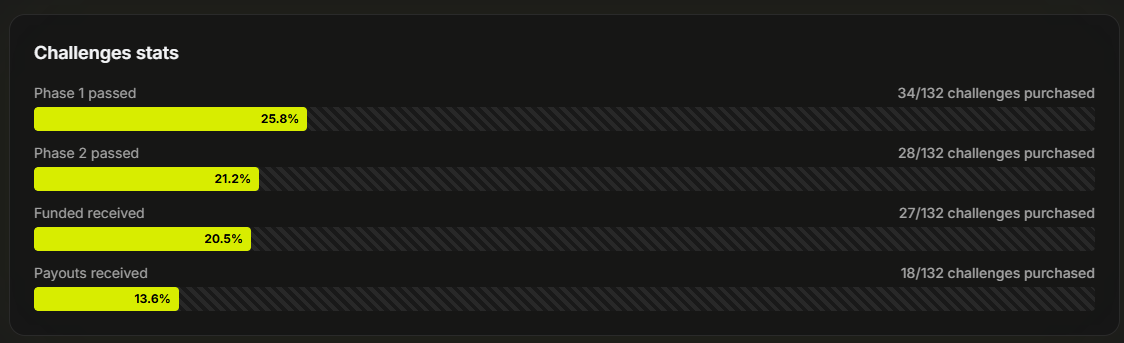
Step 2 – Review Challenges Funnel & Performance
The challenges funnel visualizes how challenges progress through:
Phase 1
Phase 2
Phase 3
Funded
Payout
Performance cards summarize pass rates for:
Phase 1
Phase 2
Funded
Payout

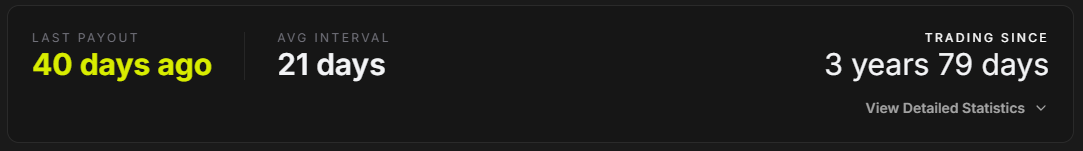
Step 3 – Analyze Payout Timelines
Timeline highlights show:
Days since last payout
Average days between payouts
“Trading since” duration
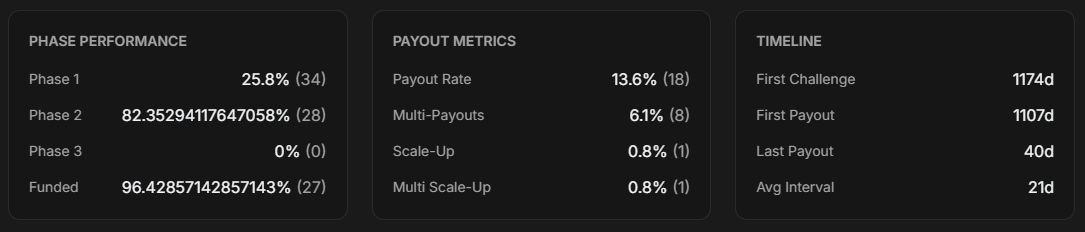
You can expand Detailed Statistics to view:
Phase performance (rates and counts)
Payout metrics:
Payout rate
Multiple payouts
Scale-ups
Multiple scale-ups
Timeline details:
Days since first challenge
Days since first payout
Average payout interval
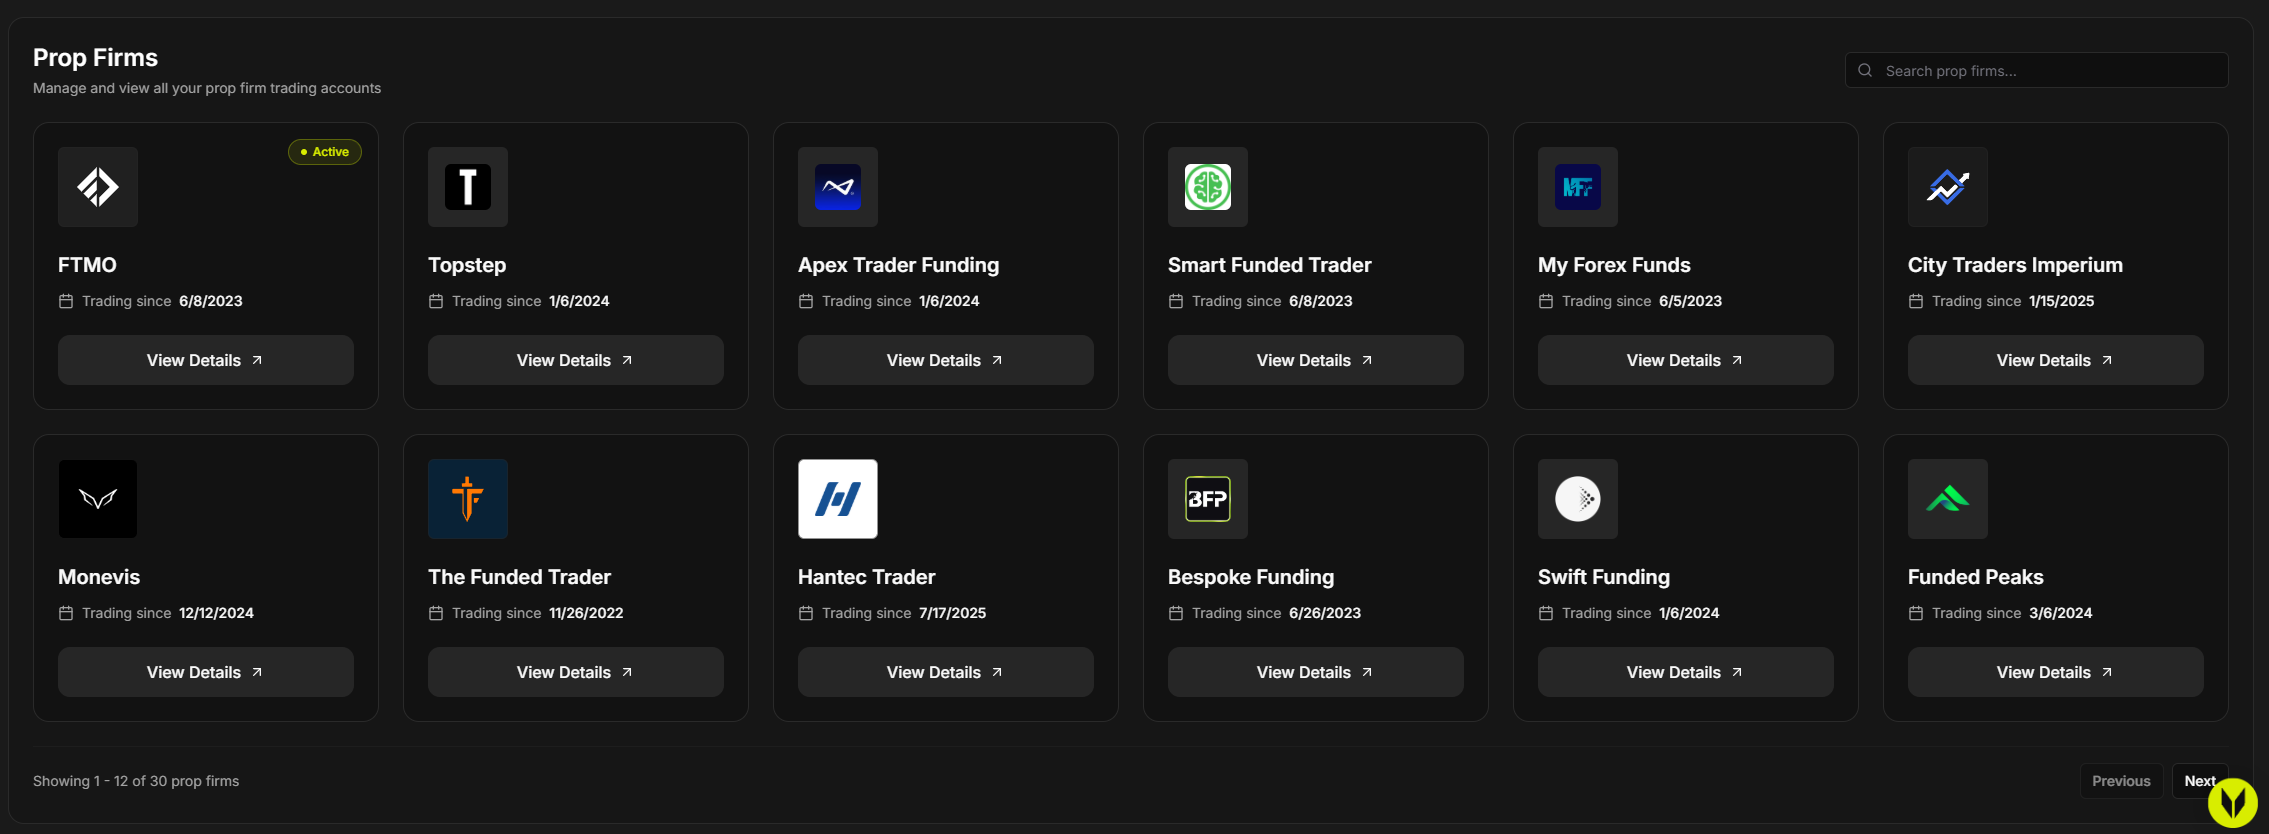
Step 4 – Browse Firm Cards
Firm cards support:
Search by firm name
Pagination
Each card displays:
Firm logo and brand color
Active badge (when a Challenge-type expense is active)
“Trading since” date (based on earliest payout or expense)
View Details action
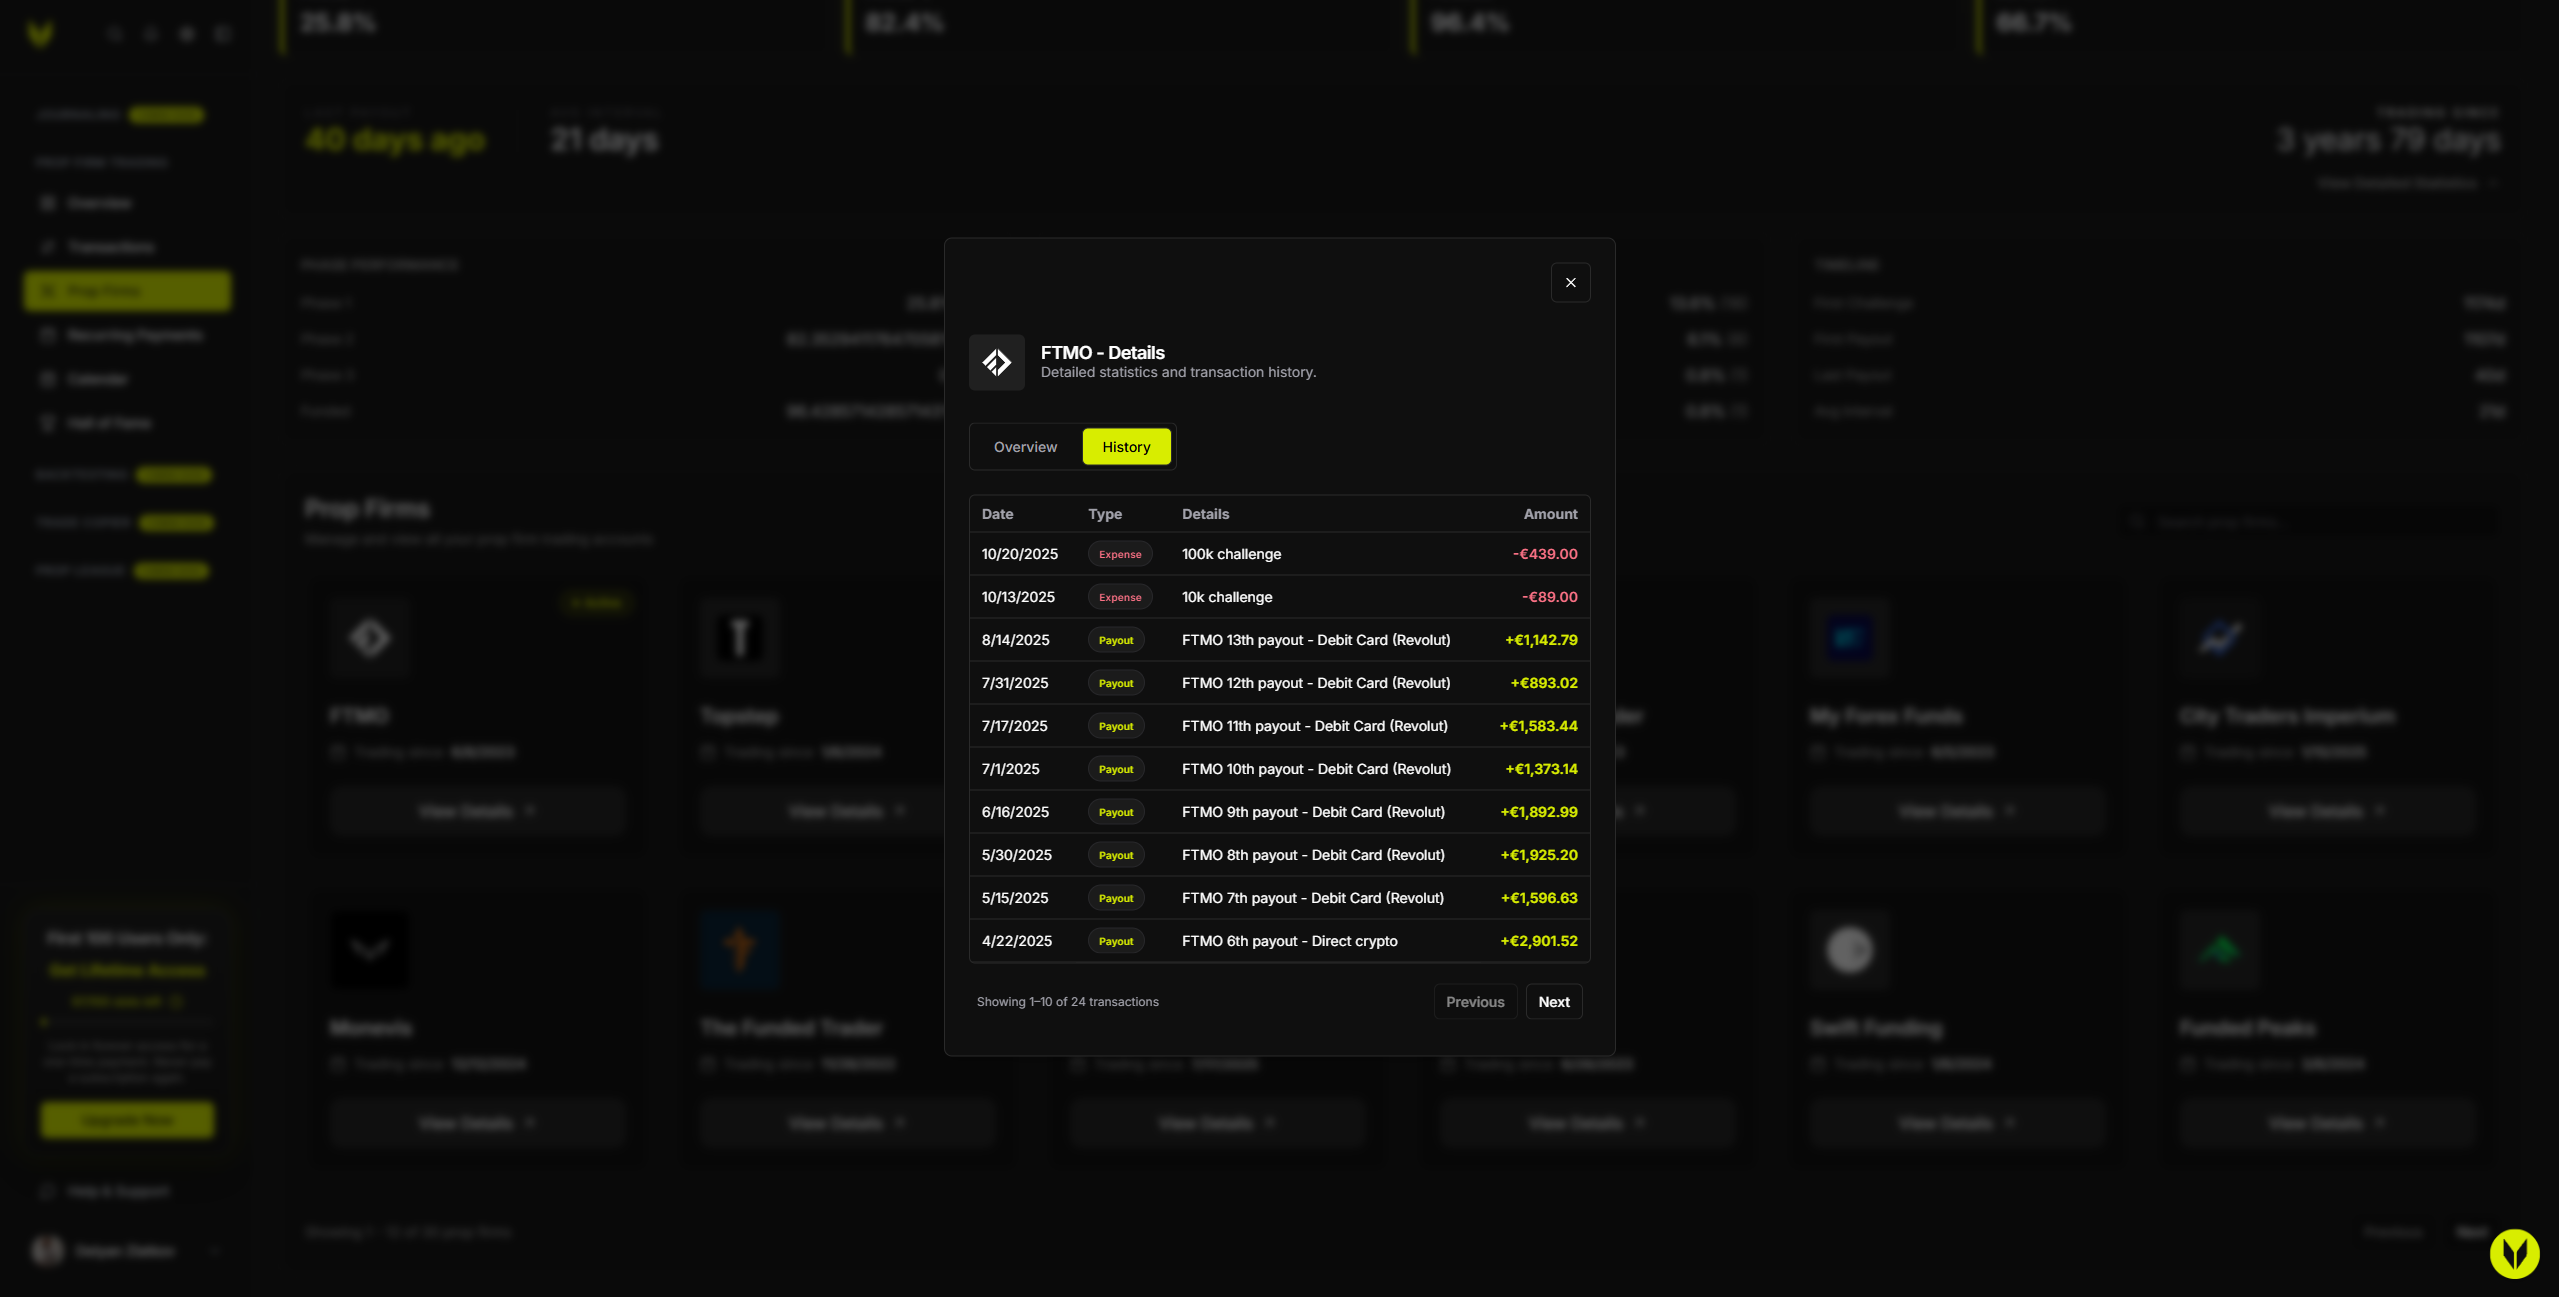
Step 5 – Open Firm Details
Click View Details on a firm card to open the firm modal.
Overview tab includes:
Total invested
Total paid
Challenges bought
Total payouts
Risk-to-reward (Invested / Paid)
Average payout processing time

History tab includes:
Paginated list of payouts and expenses
Date, type, and details
Tooltip breakdowns for:
Base amount
Activation fees
Multipliers
Final totals
Important Notes
All calculations respect multipliers and activation fees from Transactions
The Active badge is driven by active Challenge-type expenses
Read-only mode disables add/edit actions but still allows viewing dashboards and firm details
Troubleshooting
Firm Is Missing
Add at least one payout or expense for that firm in Transactions
Totals Look Incorrect
Ensure challenges are recorded as Expense Type: Challenge
Verify amounts, multipliers, and activation fees are correct