Overview Page
Detailed analytics for your prop firm trading.
Written By Delyan
Last updated 6 months ago
This article explains how to use the Prop Firm Trading → Overview page to quickly understand your profits, expenses, payouts, and overall performance.
The Overview page turns your trading data into clear charts and a monthly performance grid, helping you spot trends, compare firms, and decide where to focus next—without using spreadsheets.
How It Works
Overview Page Breakdown
The Overview page aggregates all payouts and expenses based on your selected filters and displays them in charts and a monthly grid. All visuals update automatically when filters change.
Using Overview Page
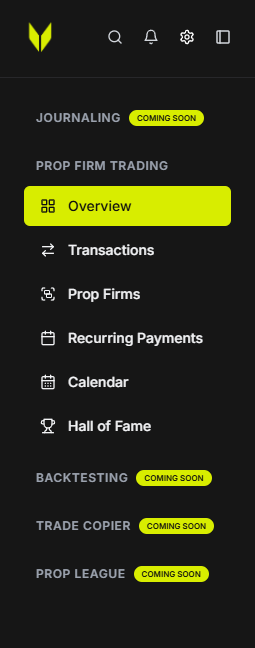
Step 1 – Open Overview
From the sidebar, navigate to:
Prop Firm Trading → Overview
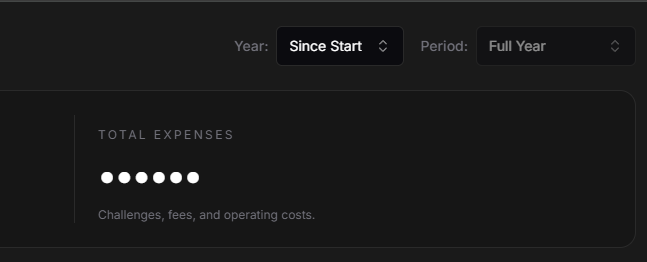
Step 2 – Select Filters
At the top of the page, choose:
Year (specific year or Since Start)
Period (Full Year, Q1–Q4, or Last Month)
Important:
When Year = Since Start, Period is locked to Full Year and shows all the available data.
Step 3 – Review Summary Cards
Summary cards show:
Total income
Total expenses
Net result for the selected period
You can use the eye icon to hide or show amounts when sharing your screen.

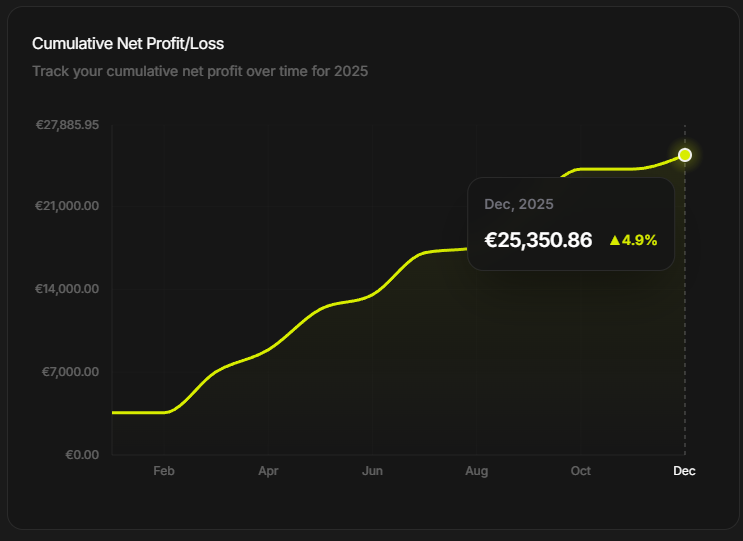
Step 4 – Analyze Charts
All charts follow your selected filters, including:
Cumulative Net Profit / Loss
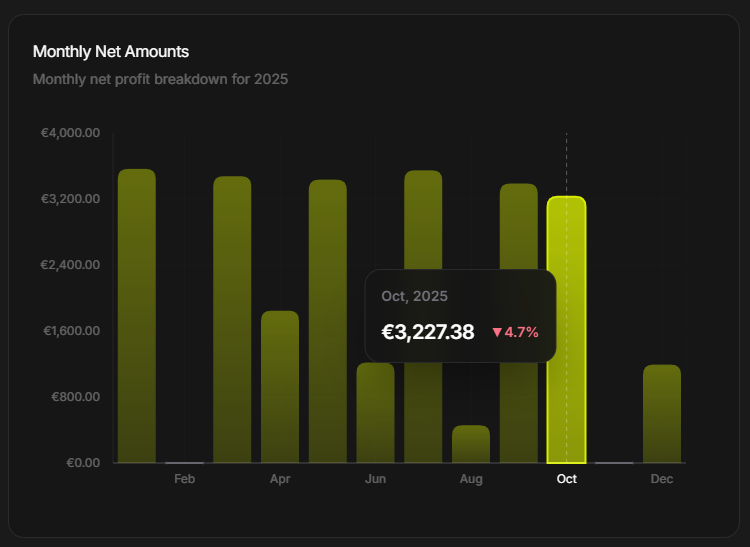
Monthly Net Amounts
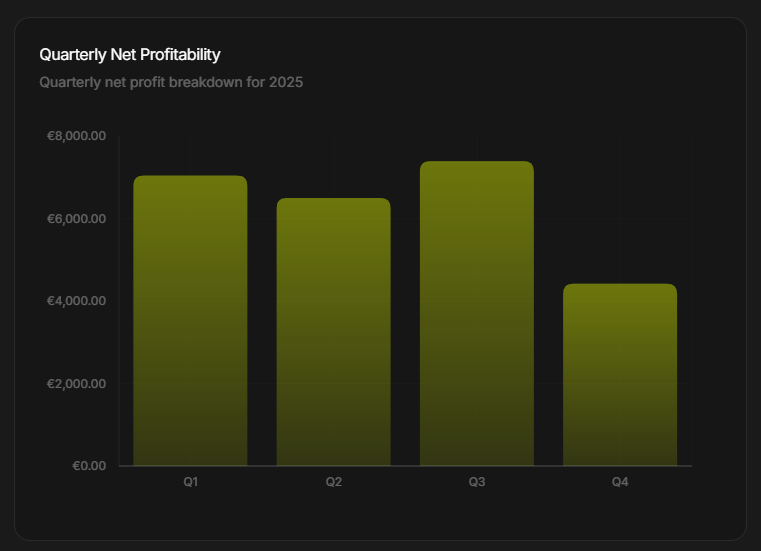
Quarterly Net Profitability (Full Year or Since Start)
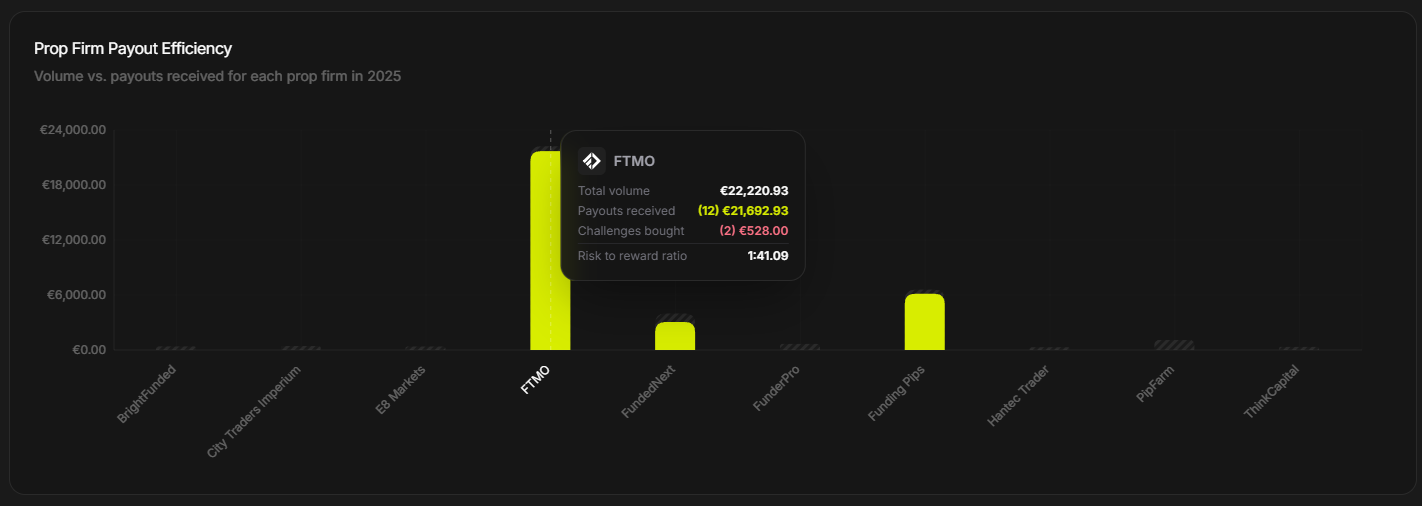
Prop Firm Payout Efficiency
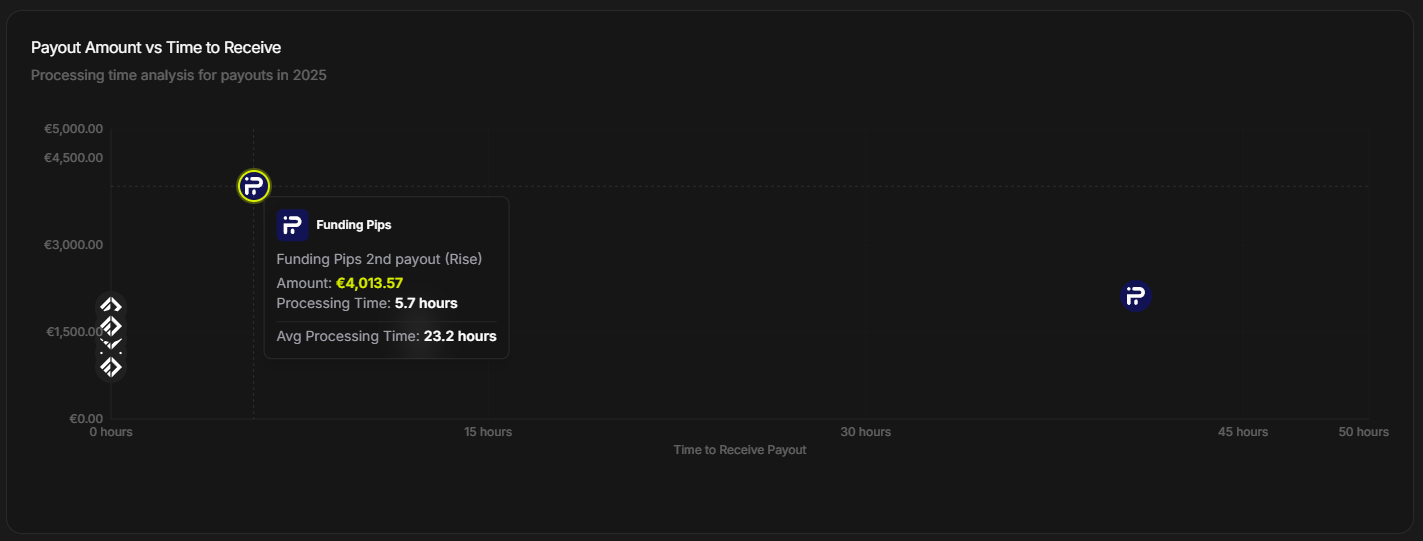
Payout Amount vs Time to Receive
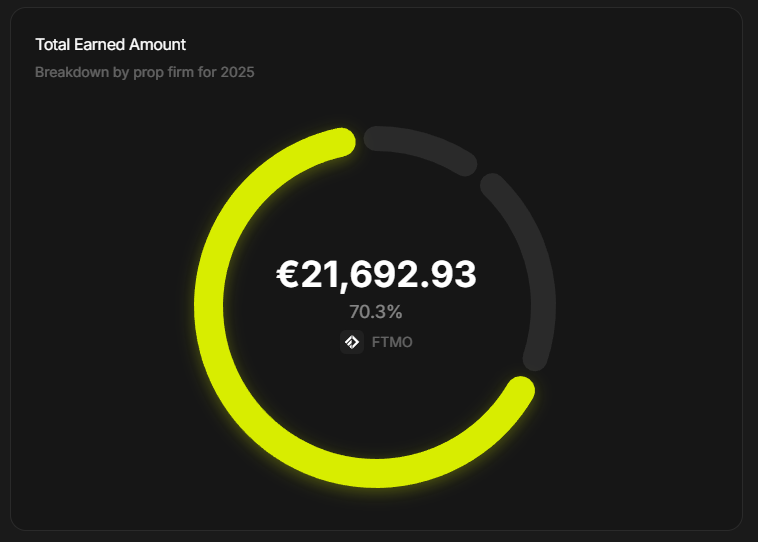
Total Earned by firm
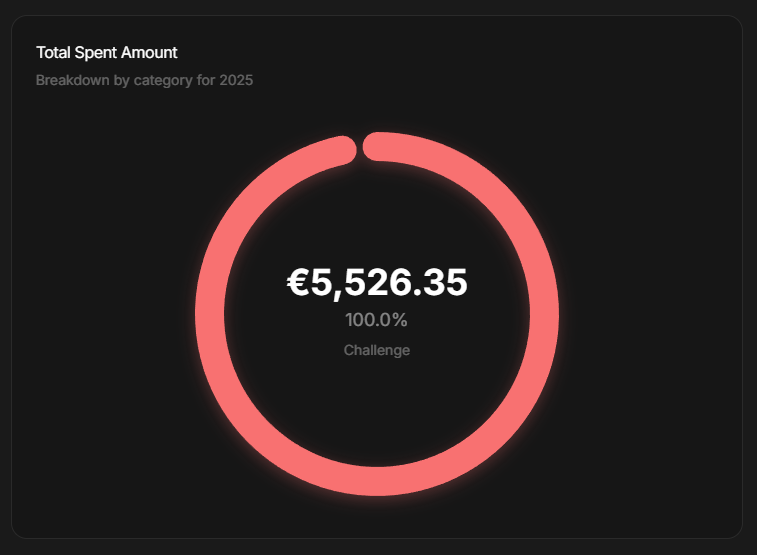
Total Spent by category
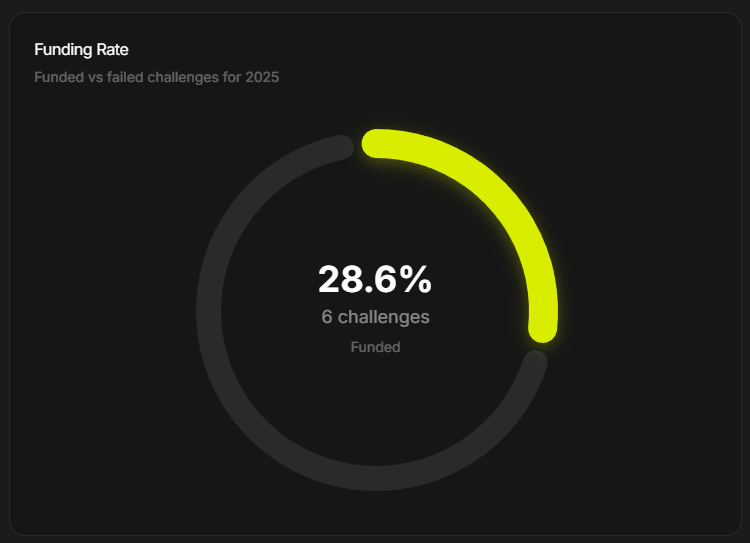
Funding Rate (funded vs failed challenges)
Step 5 – Use Monthly Performance
The Monthly Performance grid shows:
Income, expenses, and net result for each month
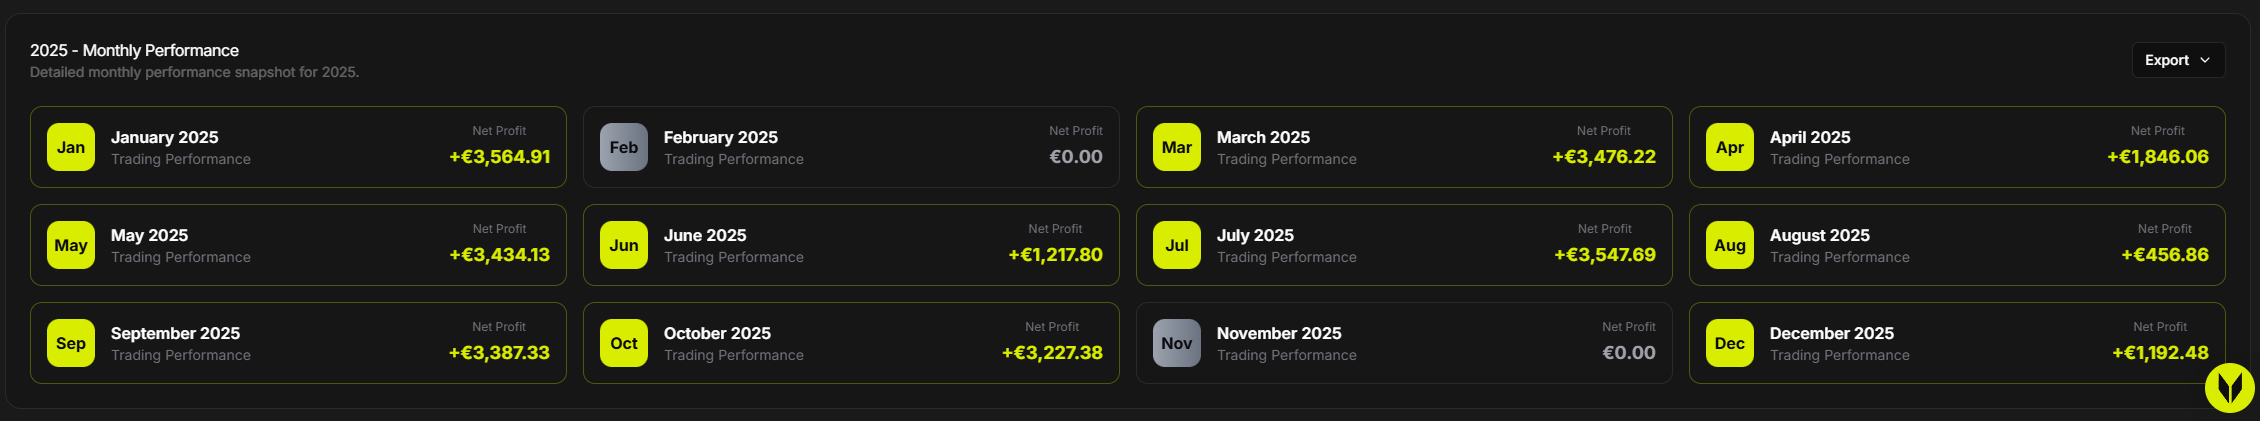
You can:
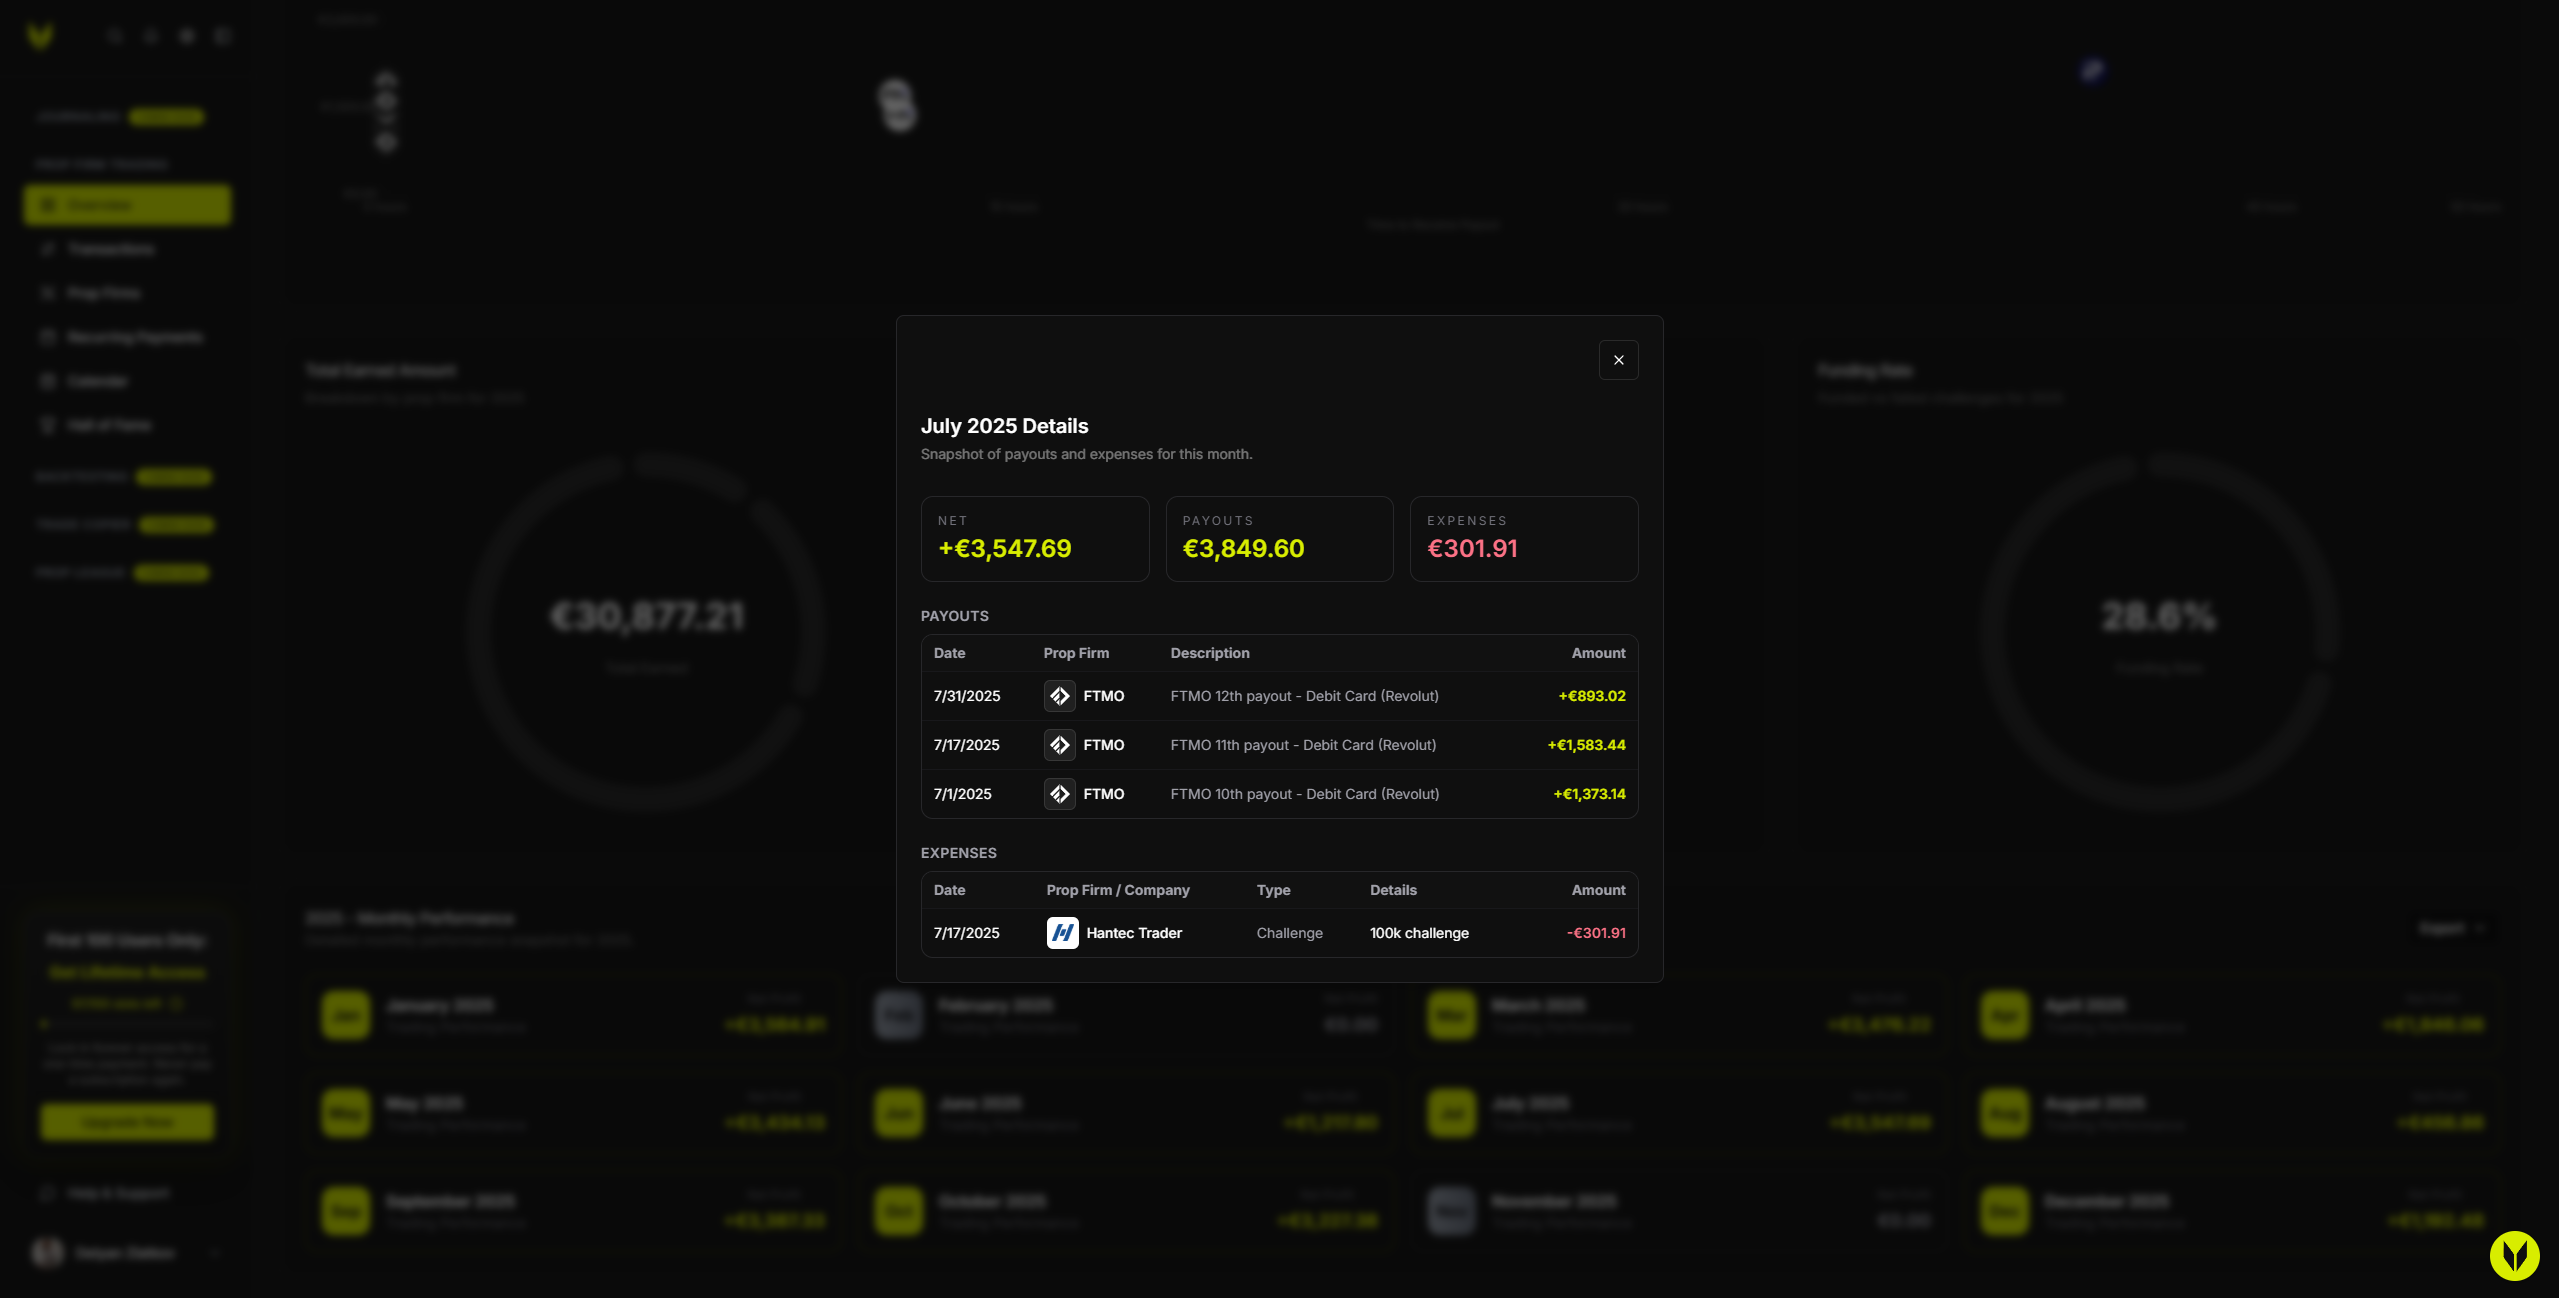
Click a month to view its payouts and expenses
Export the grid as CSV or PDF (respects filters)

Important Notes
Multipliers and activation fees are included in totals to keep net values accurate
If charts appear empty, try switching to Since Start or adding data
Troubleshooting
Charts Are Empty
Add payouts or expenses in Transactions
Expand filters to Since Start
Confirm at least one month contains data
Export Is Disabled
Ensure you are not in read-only mode if your last payment failed
Confirm there is at least one month with data